Combine MCS of emissions to a defined time period
Source:R/fct_combine_mcs_P.R
fct_combine_mcs_P.RdDepending on how the period is defined and if the data are annualized or not, calculate the Emission Level for a reference or monitoring period for each simulation.
Examples
library(readxl)
library(dplyr)
library(mocaredd)

path <- system.file("extdata/example1-4pools.xlsx", package = "mocaredd")

cs <- read_xlsx(path = path, sheet = "c_stocks", na = "NA")
ad <- read_xlsx(path = path, sheet = "AD_lu_transitions", na = "NA")
usr <- read_xlsx(path = path, sheet = "user_inputs", na = "NA")
time <- read_xlsx(path = path, sheet = "time_periods", na = "NA")

ad_clean <- ad |> dplyr::filter(!is.na(trans_area) | !is.na(trans_pdf_a))
cs_clean <- cs |> dplyr::filter(!is.na(c_value) | !is.na(c_pdf_a))
time_clean <- time |> dplyr::mutate(nb_years = year_end - year_start + 1)

sim_trans <- fct_combine_mcs_E(.ad = ad_clean, .cs = cs_clean, .usr = usr)

sim_FREL <- fct_combine_mcs_P(
  .data = sim_trans,
  .time = time_clean,
  .period_type = "REF",
  .ad_annual = usr$ad_annual
)

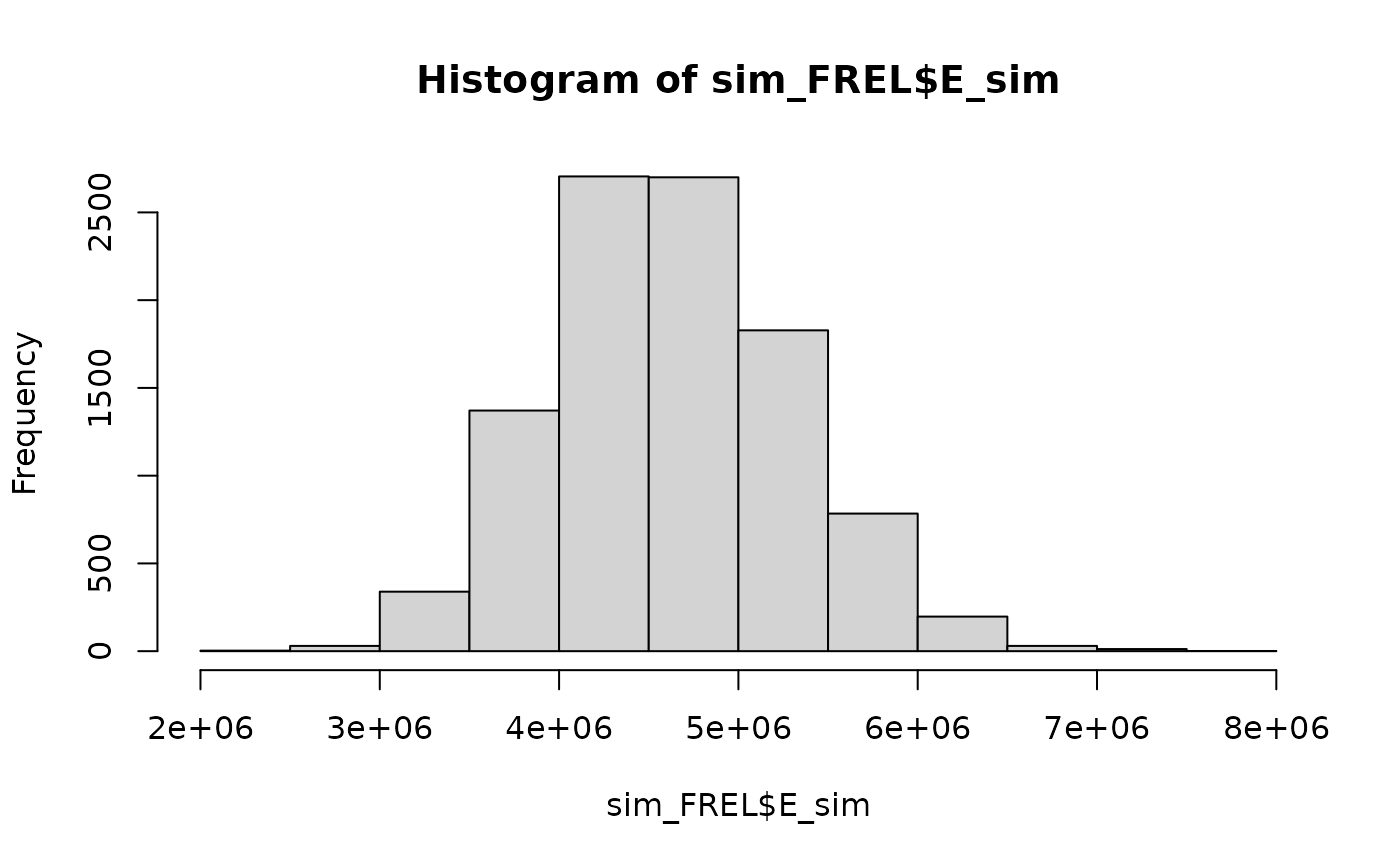
hist(sim_FREL$E)

round(median(sim_FREL$E))
#> [1] 4913572